
Small city fashion demand outpaces metros as festive spending shifts
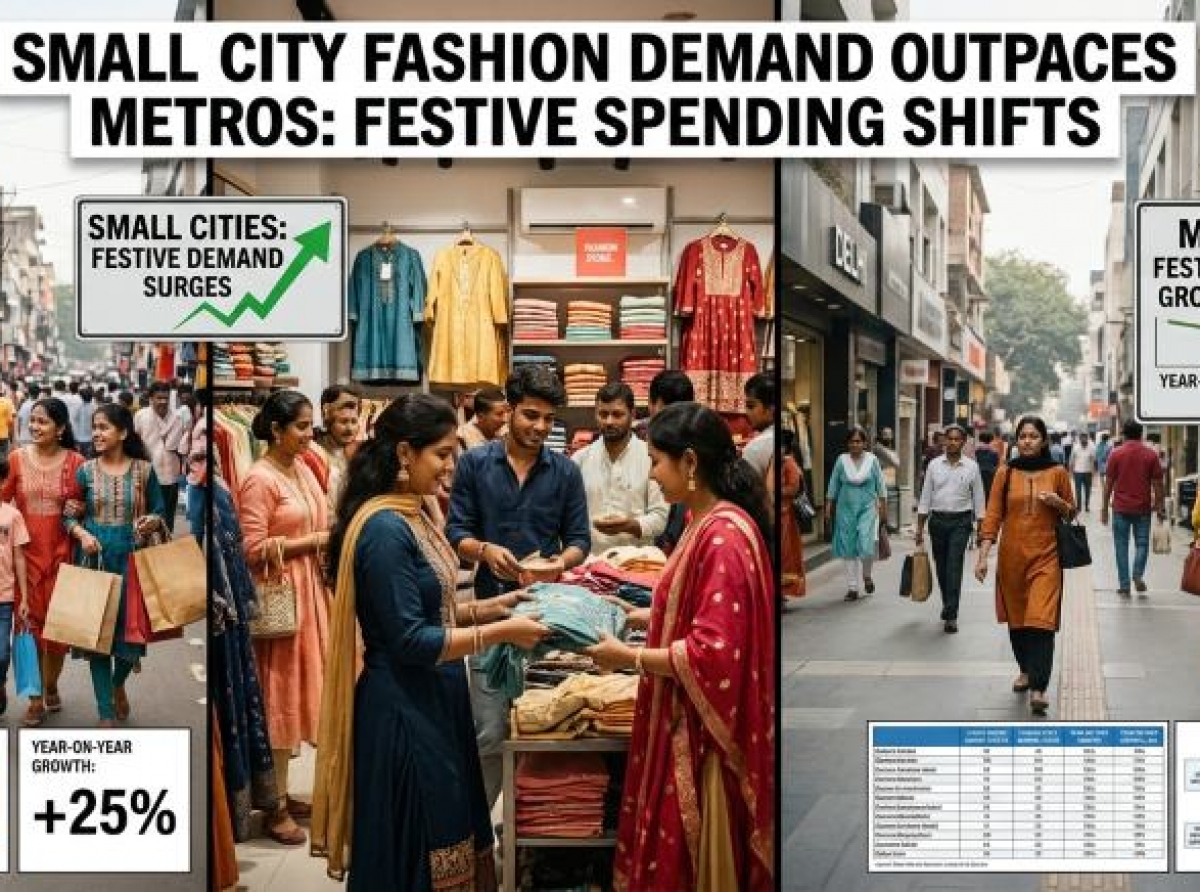
India's apparel retail growth is being driven by smaller cities rather than metros, with Tier II, III towns emerging as critical growth poles of same-store sales growth. Data for the second quarter of FY27 from the Retailers Association of India (RAI) and Innoviti Technologies' SANKET report points to resilient underlying consumption, even as monthly comparisons are complicated by a later festive calendar.
The report analyses over 70 million transactions across over 100,000 checkout points in 2,800 cities and 10,000 PIN codes. It’s like-for-like (LFL) measure tracks comparable stores, separating underlying sales momentum from growth generated by network expansion. Fashion and lifestyle sales growth grew from 4.5 per cent year-on-year in July to 8.5 per cent in August before moderating to 7.7 per cent in September. The improvement positioned fashion among the quarter's strongest-performing retail categories.
Table: Same-store sales growth by retail category
|
Retail category |
July |
August |
September |
|
Fashion and lifestyle |
4.5% |
8.5% |
7.7% |
|
Grocery and general retail |
7.5 % |
9.9% |
6.8% |
|
Jewellery and accessories |
6.9% |
8.4% |
4.1% |
|
Consumer electronics |
5% |
5% |
5.7% |
|
All categories |
7.1% |
9.6% |
6.8% |
Source: RAI-Innoviti SANKET report; year-on-year growth.
The geographic split is more revealing than the national average. Fashion sales growth in Tier II, III cities exceeded 11 per cent in September, compared to 6.2 per cent in Tier I markets. Across retail categories, Tier III cities recorded growth of 8 per cent, 11.9 per cent and 8.6 per cent in July, August and September, respectively. Tier I markets posted 6.5 per cent, 7.6 per cent and 7.1 per cent. The growing gap in August, when Tier III growth exceeded Tier I by 4.3 percentage points, underscores the importance of smaller-city consumption. Although the differential narrowed to 1.5 percentage points in September, smaller markets continued to outperform.
For apparel retailers, this shifts the strategic emphasis from store additions alone to the productivity of existing outlets. Regional demand, accessible price points and merchandise suited to local purchasing patterns are becoming increasingly important to sustaining growth.
Festive timing distorts
The quarter's monthly performance must be read against a shifted festival calendar. In 2025, Navratri and Durga Puja shopping fell earlier, while in 2026, Onam arrived on August 26 and Ganesh Chaturthi on September 14. Pitru Paksha began on September 27, followed by Navratri from October 11, pushing a substantial part of festive purchasing into October. The timing helps explain September's moderation, particularly in eastern India, where Durga Puja-related purchases are a major apparel sales driver.
Table: Same-store retail growth by region
|
Region |
July YoY growth |
August YoY growth |
September YoY growth |
|
South India |
+7.9% |
+9.7% |
+7.9% |
|
West India |
+7.2% |
+10.7% |
+6.9% |
|
North India |
+5.1% |
+8.1% |
+4.8% |
|
East India |
+6.9% |
+7.5% |
+2.7% |
Source: RAI-Innoviti SANKET report; year-on-year growth.
South India delivered the steadiest performance, supported by early Onam spending, while West India peaked at 10.7 per cent in August. North India's apparel performance remained strong, with fashion growth above 11 per cent in both August and September. East India's September slowdown, however, did not necessarily indicate weakening demand. A supplementary SANKET audit comparing the fortnight before Navratri in 2026 with the corresponding festival-aligned period in 2025 found that digitally paid spending across India rose 13.9 per cent. East India recorded 21.7 per cent growth, while its fashion and lifestyle spending rose 28.3 per cent, against 14.7 per cent in the rest of the country.
The comparison highlights the risk of treating calendar-month performance as a definitive measure of festive demand. RAI chief executive Kumar Rajagopalan points out a more accurate assessment would emerge from comparing corresponding festive periods, as the season's timing had shifted from the previous year.
Value formats gain
The consumption shift strengthens the case for value-led fashion retail outside metropolitan markets. Trent's Zudio and Westside, Reliance Retail's Trends and Yousta, Aditya Birla Fashion and Retail's Pantaloons and Style Up, and Landmark Group's Max Fashion are among the formats targeting a wider range of urban catchments.
Zudio shows the appeal of a model built around sharp pricing, rapid inventory turnover and expansion into smaller-city high streets. Its price positioning, with much of its assortment below Rs 999, aligns with consumers seeking wardrobe upgrades without a substantial increase in discretionary spending.
However, rising sales do not automatically translate into stronger profitability. Retailers must balance local demand with inventory availability, store-level operating costs and working capital, particularly when festive purchases shift between reporting periods.
UPI changes checkout
Payment data adds another dimension to the changing retail landscape. UPI-linked spending consistently outpaced card-linked spending during the quarter, indicating a continued shift in how customers pay at physical stores.
Table: Payment growth by tender type
|
Tender type |
July YoY growth |
August YoY growth |
Sept YoY growth |
|
UPI-Linked Spending |
+20.5% |
+22.6% |
+17.6% |
|
Card-Linked Spending |
-0.60% |
+0.4% |
-3.60% |
Source: RAI-Innoviti SANKET report; year-on-year growth.
Fashion retail recorded sustained mid-teens growth in UPI payments, while card spending remained flat or contracted across the wider retail payment mix. Jewellery was an exception in September, when card spending grew 4.5 per cent, compared to 3.1 per cent for UPI, reflecting the different payment dynamics of higher-ticket purchases.
For retailers, these trends have implications for checkout infrastructure, payment costs, transaction analytics and customer engagement. Innoviti founder and chief executive Rajeev Agrawal says the data could help merchants improve inventory planning and respond more effectively to changing demand.
Q3 holds the test
The second-quarter data points to a more geographically distributed fashion market, with smaller cities delivering stronger comparable-store growth and value formats positioned to capture demand. Yet the decisive test will be whether the festive shift converts into sustained sales and improved margins in the third quarter.
October and November bring Navratri, Durga Puja, Karwa Chauth, Dhanteras and Diwali, followed by the winter wedding season. This creates an extended opportunity for apparel retailers, but also raises the cost of holding inventory for longer. The important takeaway is that India's fashion retail growth is no longer adequately explained by metropolitan consumption or store expansion alone. Comparable-store performance in Tier II, III markets, combined with festival-adjusted demand and evolving payment behaviour, is becoming essential to understanding the sector's next phase.









 Get in Touch!

